
It's a WEEK-A KEEPA! Day 1/5: What does Sales Rank actually mean?
(Scroll down to see how you can get my NEW $350 Bonus Box for FREE 📦📦📦)
My newest book, The Flip Game , has a BONUS GUIDE all about scanning BARCODES and scanning BOOKS.
And when you scan a barcode using ScanPower or the Amazon app, you can see the current selling price and the Sales Rank.
Learning to understand Sales Rank and how to read Keepa graphs is easily one of the most important things that you can do to become a successful online seller. The reason it's VITAL is so that you know the difference between something that sells FREQUENTLY and something that has sold RECENTLY.
If any of this seems complicated, I understand. But STICK WITH ME! I've been looking at Keepa graphs for over TEN YEARS and I promise that YOU can learn this, too.
In the simplest form, the data provided by Amazon, ScanPower, and Keepa will tell you HOW MUCH the item will sell for, HOW QUICKLY it will sell, how FREQUENTLY it sells and what the net PAYOUT will be when it sells.
But, like most things, it's NOT that simple.
When you scan an item, you are only seeing the Sales Rank as a SNAPSHOT in time. You're seeing the Sales Rank RIGHT NOW and items can have the EXACT SAME Sales Rank but can literally mean completely different things.
But let's not get too far ahead of ourselves. First, you need to understand how Sales Rank WORKS and how it CHANGES as an item SELLS (and also DOESN'T SELL).
You can see the Sales Rank for any item on the Amazon Product Page, but if you want to see a graph of an item's HISTORICAL Sales Rank, you need to use Keepa.
Keepa is arguably the #1 most popular and most useful website for Amazon sellers. https://keepa.com/
They also have free browser extensions: https://keepa.com/#!addon
So let's look at what happens to Sales Rank OVER TIME as an item ISN'T SELLING and then see what happens when the item DOES SELL.
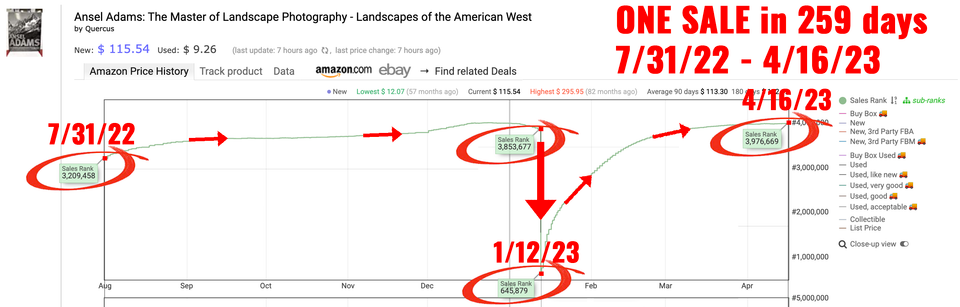
This image shows an item that has SOLD ONCE in the past 259 days. I used this item to really isolate the behavior of a Keepa Sales Rank graph over time with a known number of sales.
On 7/31/22, this item had a Sales Rank of 3,209,458 and it SLOWLY ROSE HIGHER to 3,853,677 (no sales) until 1/12/23 when the Sales Rank SHARPLY DROPPED to 645,879. The large RED ARROW shows how the Sales Rank CHANGES in response to a SALE.
Then, as time passes without any sales, the Sales Rank slowly climbs higher and higher again. In this example, the Sales Rank slowly rose to 3,976,669 by 4/16/23.
With this information, you can calculate the exact number of sales over a given period of time.
But depending WHEN you scanned this item during this 259-day period, you could see a Sales Rank as LOW as 645,879 or as HIGH as 3,976,669.
And even though the SALES RATE for this item is still just ONE SALE in 259 days (actually ONE SALE in the past 95 days), regardless of the Sales Rank that you see (depending on WHEN you scanned it).
Remember, you're using Sales Rank to help you DECIDE that to buy. That includes HOW MUCH to pay for items as well as HOW MANY items to buy.
If you saw TEN COPIES of this book at a book sale and you scanned it when the Sales Rank was 645,879, you may be inclined to buy ALL TEN COPIES because you could interpret the Sales Rank as an item that sells FREQUENTLY.
This is the important part! You need to know the difference between something that sells FREQUENTLY and something that has sold RECENTLY.
While FREQUENTLY 'might' be true, the only that the 645,879 Sales Rank actually means is that this item has sold RECENTLY. To calculate FREQUENCY, you have to look at Sales Rank over TIME.
If this item sells for $100 and copies were $1 each and you bought all ten, this may not be much of a mistake, but you may end up buying 10+ years' supply. If copies were priced at $20 each or $50 each, you'd likely make a different decision. And if this item sells for just $10 (compared to $100), this is also going to affect your buying decision.
Or you might simply PASS on this item if you scanned it when the Sales Rank was 3,976,669 (indicating that it has not sold in a long time). This may be true, and, for some lower-priced books, this may be the correct choice. But you might be missing a $100+ book that does sell, although infrequently (like this one).
So when you see these DROPS or SPIKES in the Keepa Sales Rank graph, you KNOW that this indicates a SALE. You can then use this information OVER TIME to calculate the exact number of SALES.
This is POWERFUL INFORMATION that can help you make SMART buying decisions (especially if buying higher quantities of an item)! I trust that you realize how AWESOME it is that we have access to this kind of information. When I first started selling online (1999), we barely had cell phones, let alone iPhones, scanning apps, and historical graphs of an item's Sales Rank!
A simple Keepa graph (like this one) has SO MUCH VALUABLE INFO (but only if you know how to read it).
More about Keepa TOMORROW!
Want to learn EVEN MORE about Sales Rank and Keepa graphs?
Perfect timing! The next OA Challenge starts on April 24th (SOON!)
I thought that I knew a lot about Keepa but the GOLD STANDARD for Keepa training comes from Christopher Grant in the OA Challenge.
The OA Challenge includes TWO FULL WEEKS of LIVE Online Arbitrage training with Christopher Grant where he will teach you everything you'll ever need to know about Online Arbitrage and selling on Amazon.
Anyone who signs up using the links in my email will get my AWESOME $350 BONUS BOX!
The BONUS BOX includes:
1. A printed copy of Online Arbitrage ($100)
2. A printed copy of The Authorpreneur Blueprint ($200)
3. A printed copy of Gary Vaynerchuk's #AskGaryVee book ($20)
4. A RARE, SOLD OUT Blue Origin snapback hat ($30) (I bought them out two years ago when Jeff Bezos first went to space)
I'll explain more about the ALIEN soon.
https://locomodem--entreresource.thrivecart.com/oa-challenge/
Any questions, please ask!
Chris